|
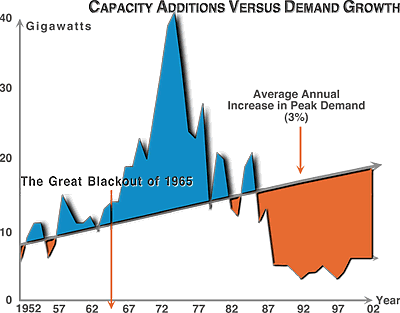
Capacity Chart
|

Demand is smoothed to exclude year-to-year weather effects.
Note that an equal absolute increase in demand diminishes each year as a percentage due to cumulative additions.
WHY NOT STOP USING COAL? | HOME | HELP | WEBMASTER | SITE MAP
©1998 byDesign and PowervisioN for The Greening Earth Society—703.907.6168